Parrot Analytics Data Visualization: Transforming Complex Media Insights into Engaging Visuals


In collaboration with Parrot Analytics, a global leader in media analytics, I developed a series of impactful data visualizations and poster artworks.
Parrot Analytics, renowned for its work with major media, tech, and consulting companies, required visuals that not only conveyed complex data but also engaged a diverse audience.
My task was to translate intricate data sets into visually compelling formats that effectively communicated key insights and supported Parrot Analytics' mission to drive understanding and innovation in media analytics.Challenges Identified
Challenges
The primary challenges for this project included:
Complex Data Representation: Media analytics data is often intricate and multi-layered, making it difficult for stakeholders to quickly grasp key insights.
Diverse Audience Engagement: The visuals needed to engage a wide range of audiences, from industry experts to clients with varying levels of data literacy.
Brand Consistency: It was essential to maintain Parrot Analytics’ brand consistency across all visual outputs, ensuring a unified visual identity.
Design Goals
To address these challenges, the project focused on achieving the following goals:
Simplify Data Presentation: Create clear and concise data visualizations that make complex media analytics data easily interpretable for all stakeholders.
Enhance Audience Engagement: Design visuals that capture the attention of a diverse audience while effectively communicating the essence of Parrot Analytics’ services and findings.
Maintain Brand Integrity: Ensure all visual elements align with Parrot Analytics’ brand guidelines, reinforcing their reputation as a leader in media analytics.
Project Process
The design process involved several stages to ensure the final visuals were both effective and engaging:
Understanding the Data: Worked closely with Parrot Analytics’ data scientists and marketing teams to gain a deep understanding of the data sets and the key insights that needed to be highlighted. This involved multiple meetings to discuss data interpretation and the best ways to visualize it.
Concept Development: Developed initial concepts for data visualizations and poster artworks, focusing on clear communication and visual impact. This stage included sketching, wireframing, and creating mockups to explore different visual approaches.
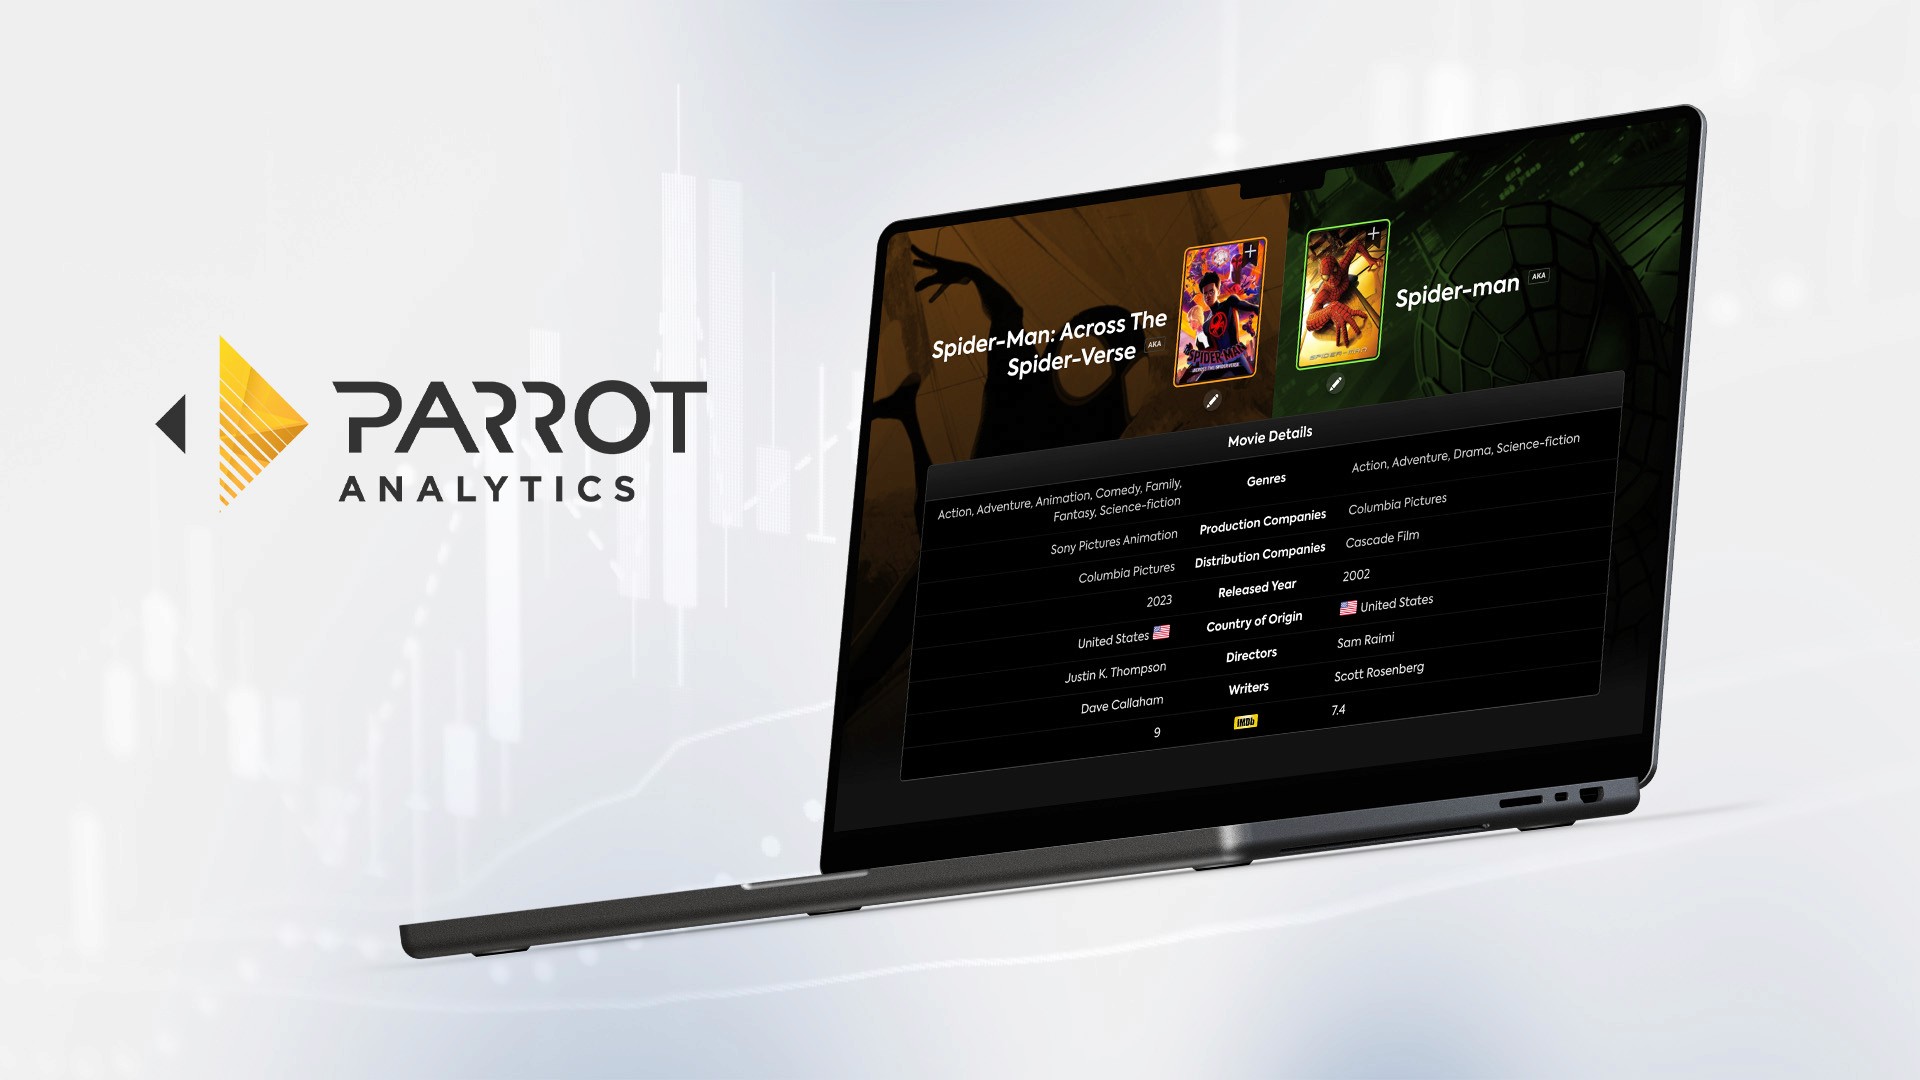
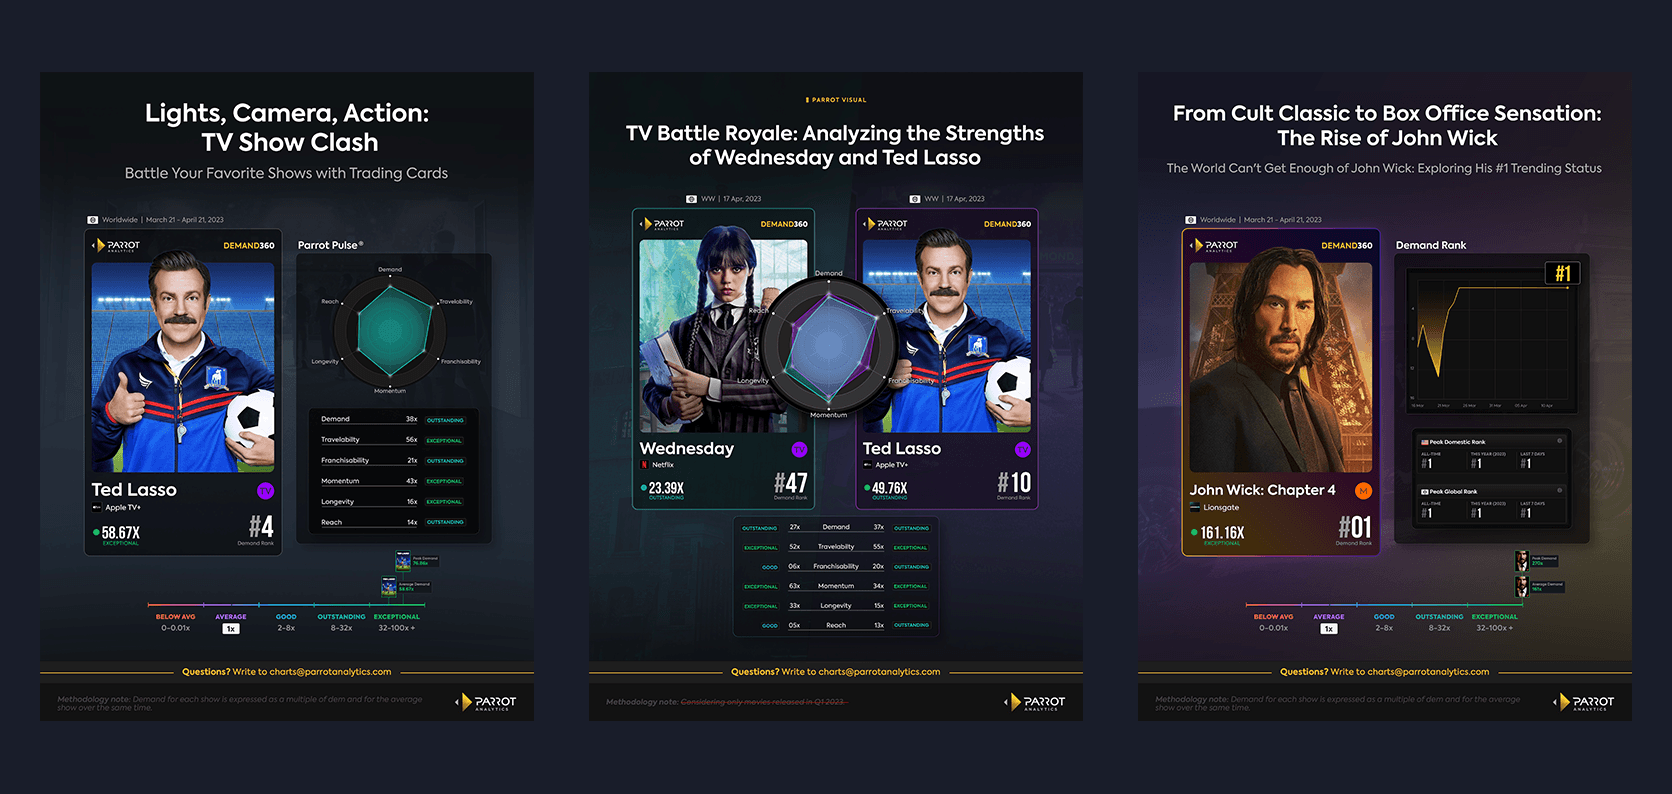
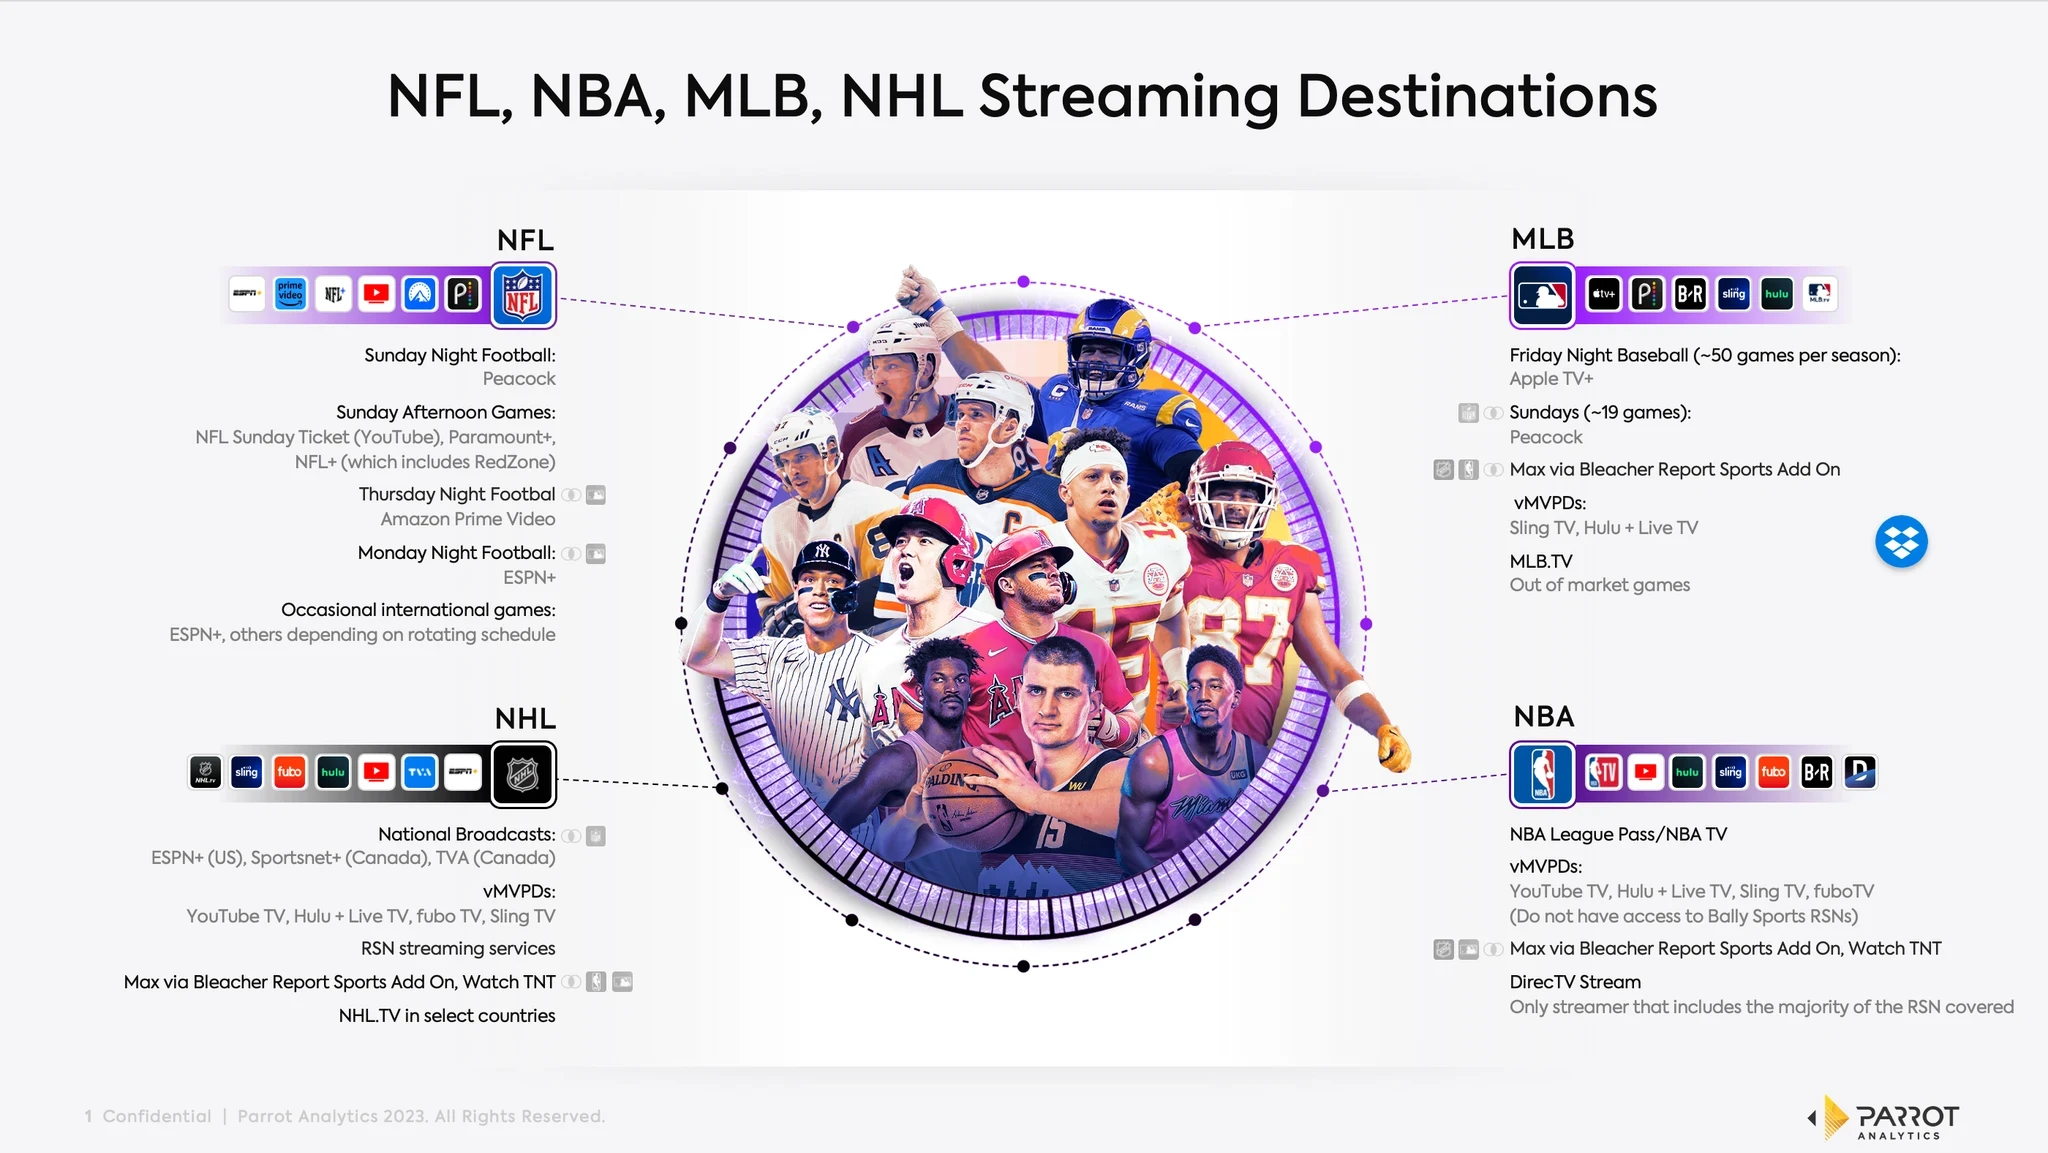
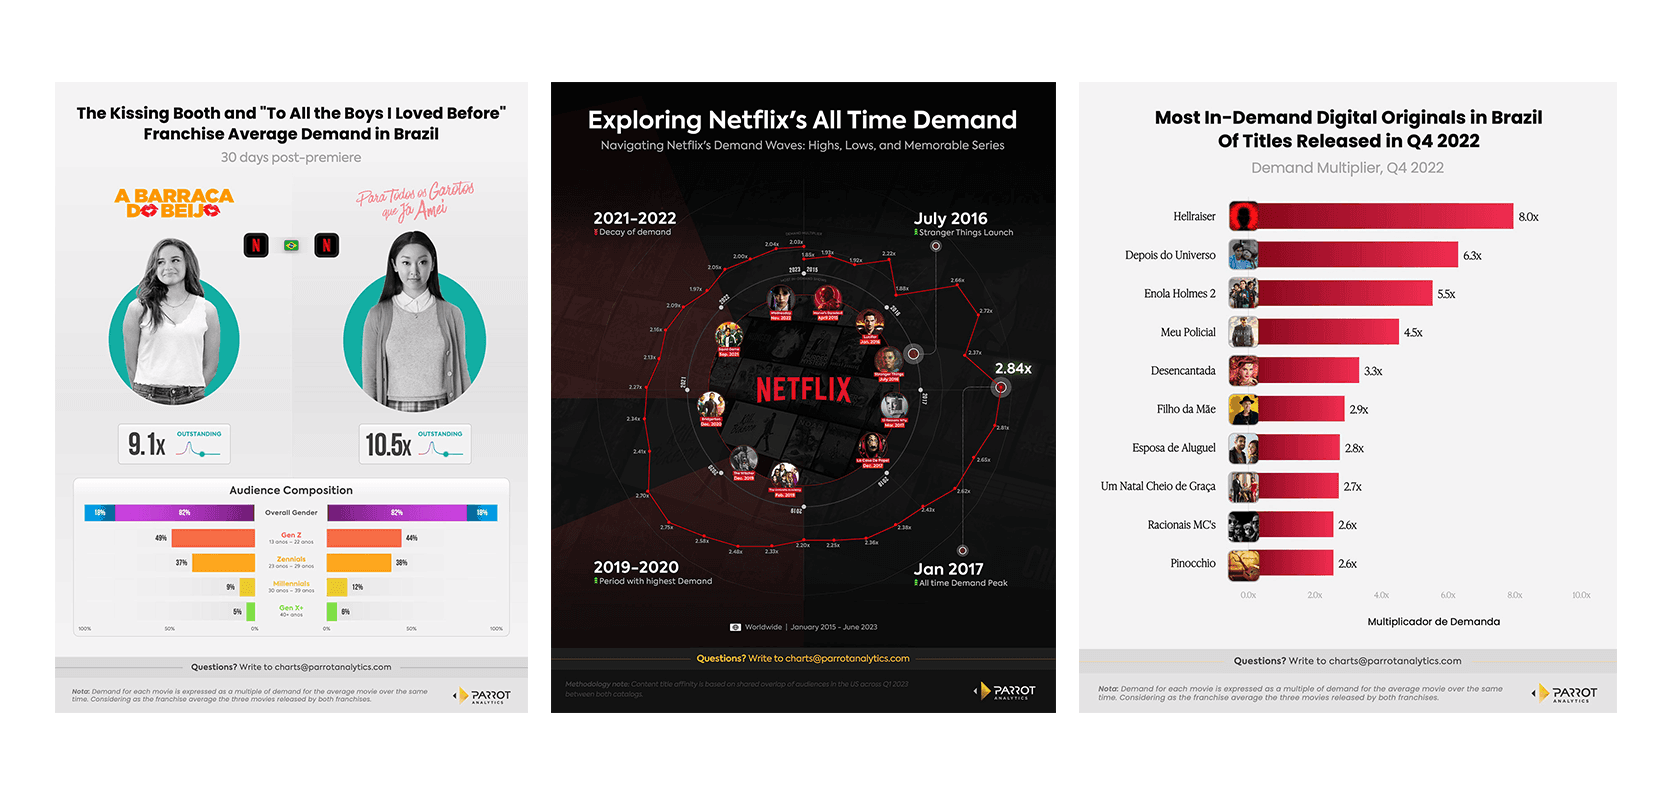
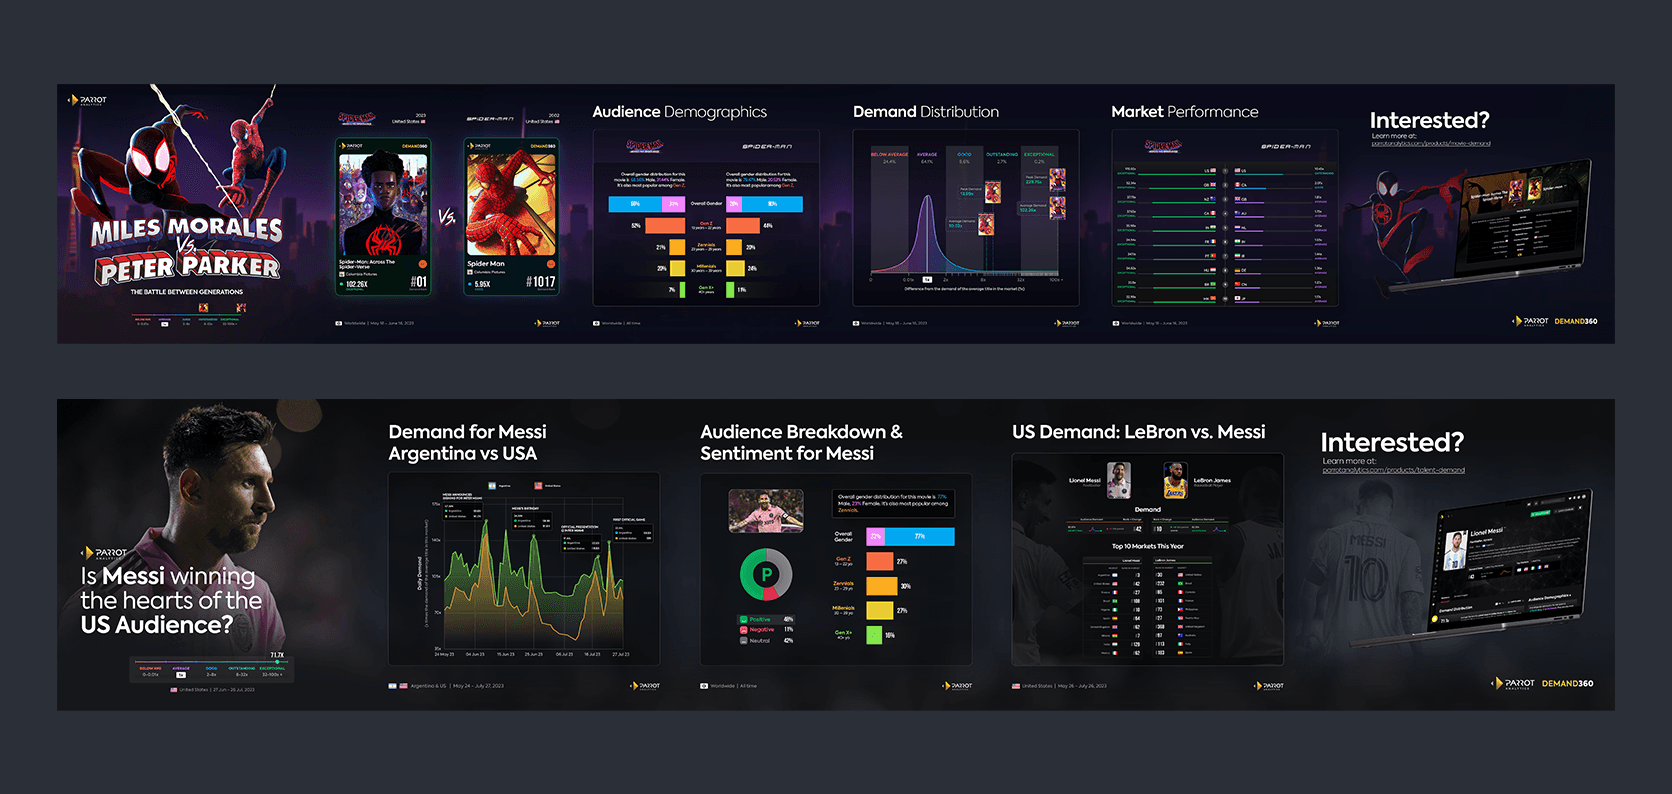
Design Execution: Crafted a series of data visualizations tailored to present intricate media analytics data in a clear and compelling manner. Each visualization was meticulously designed to highlight key insights, making it easier for stakeholders to interpret trends and make data-driven decisions.
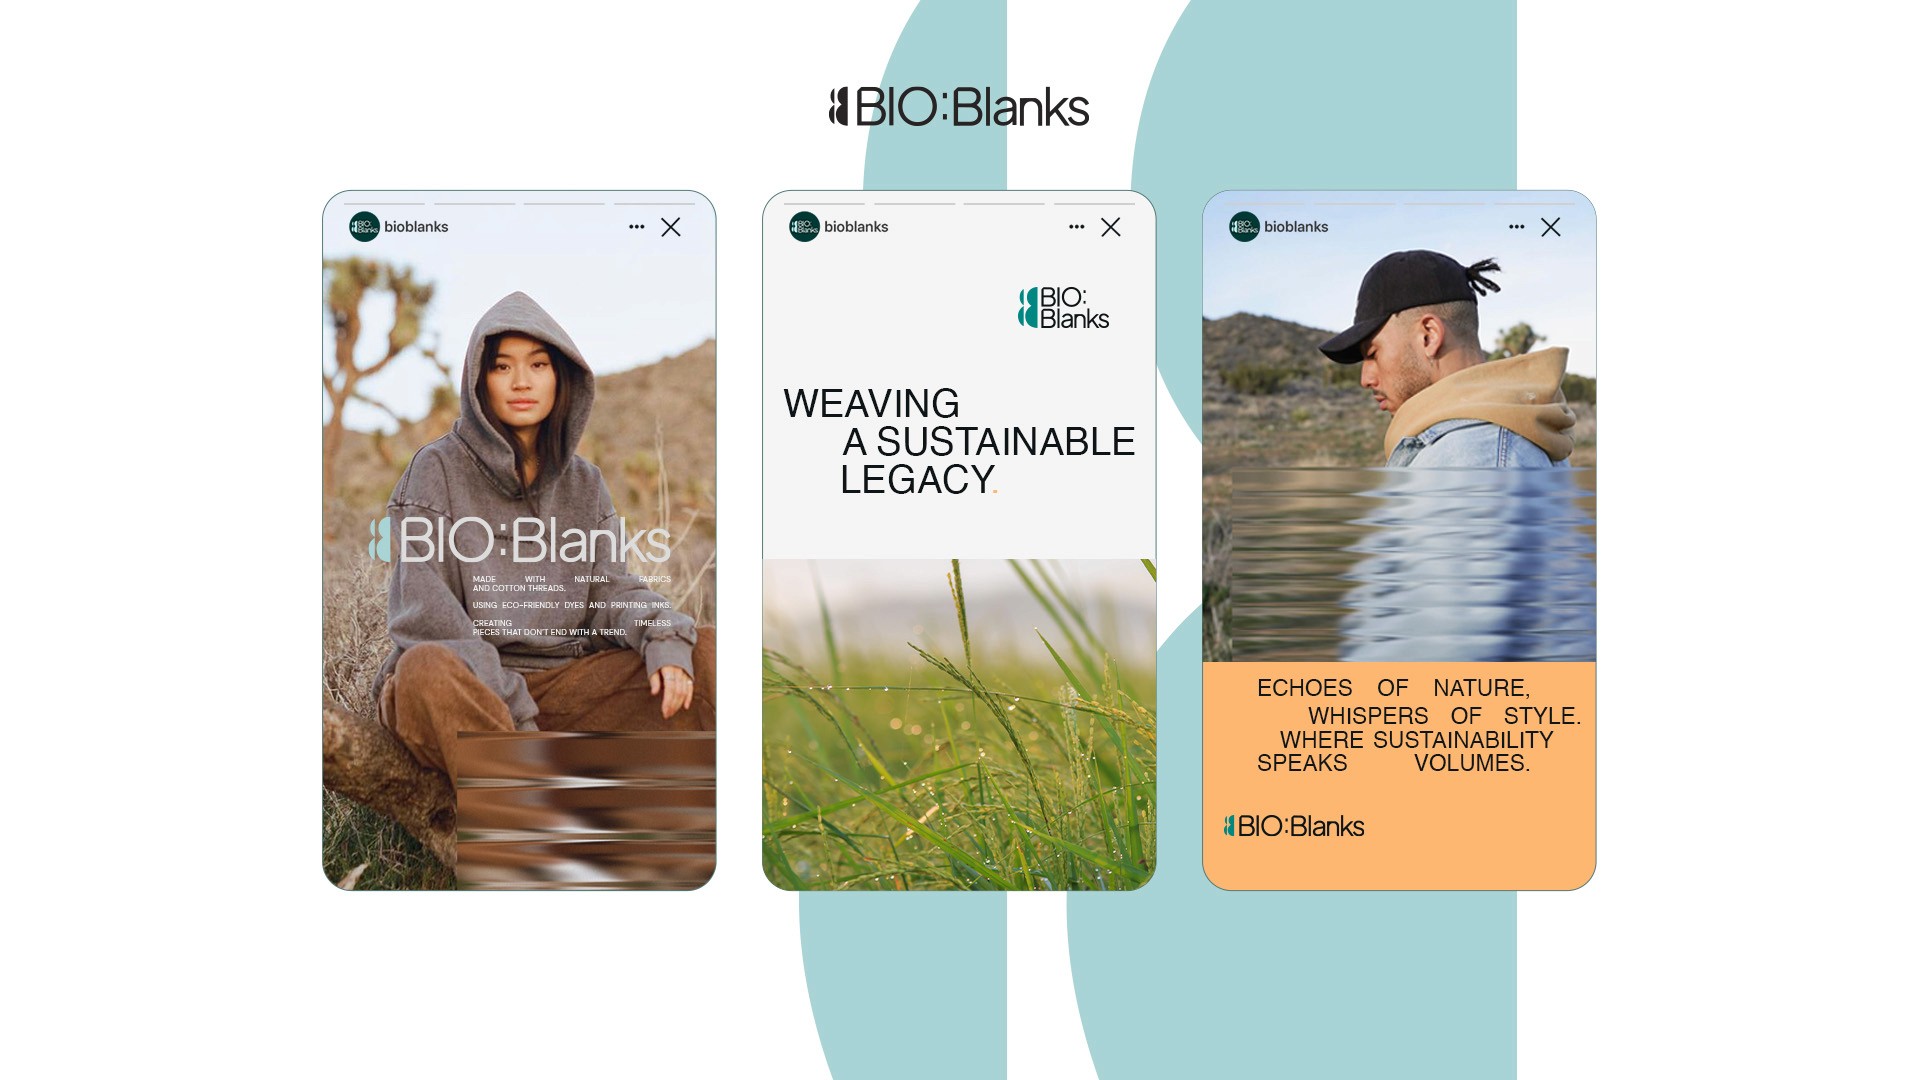
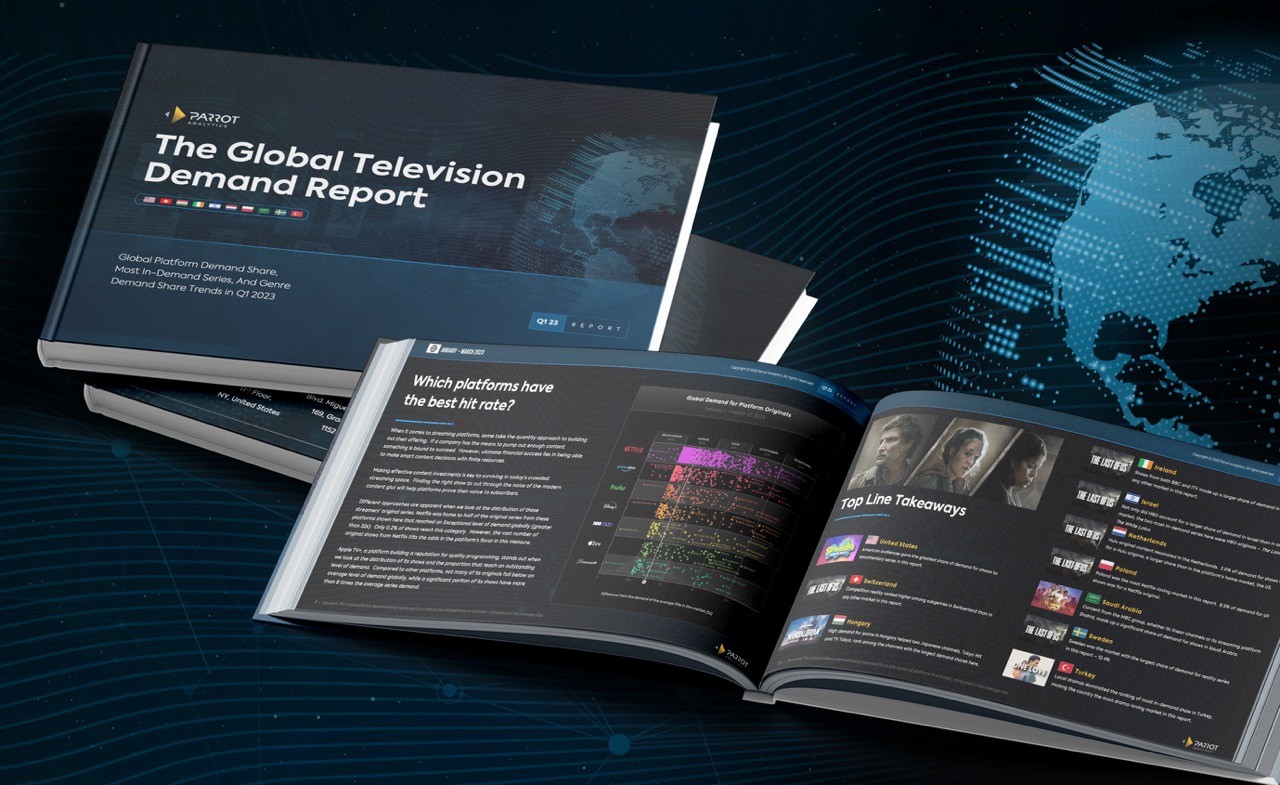
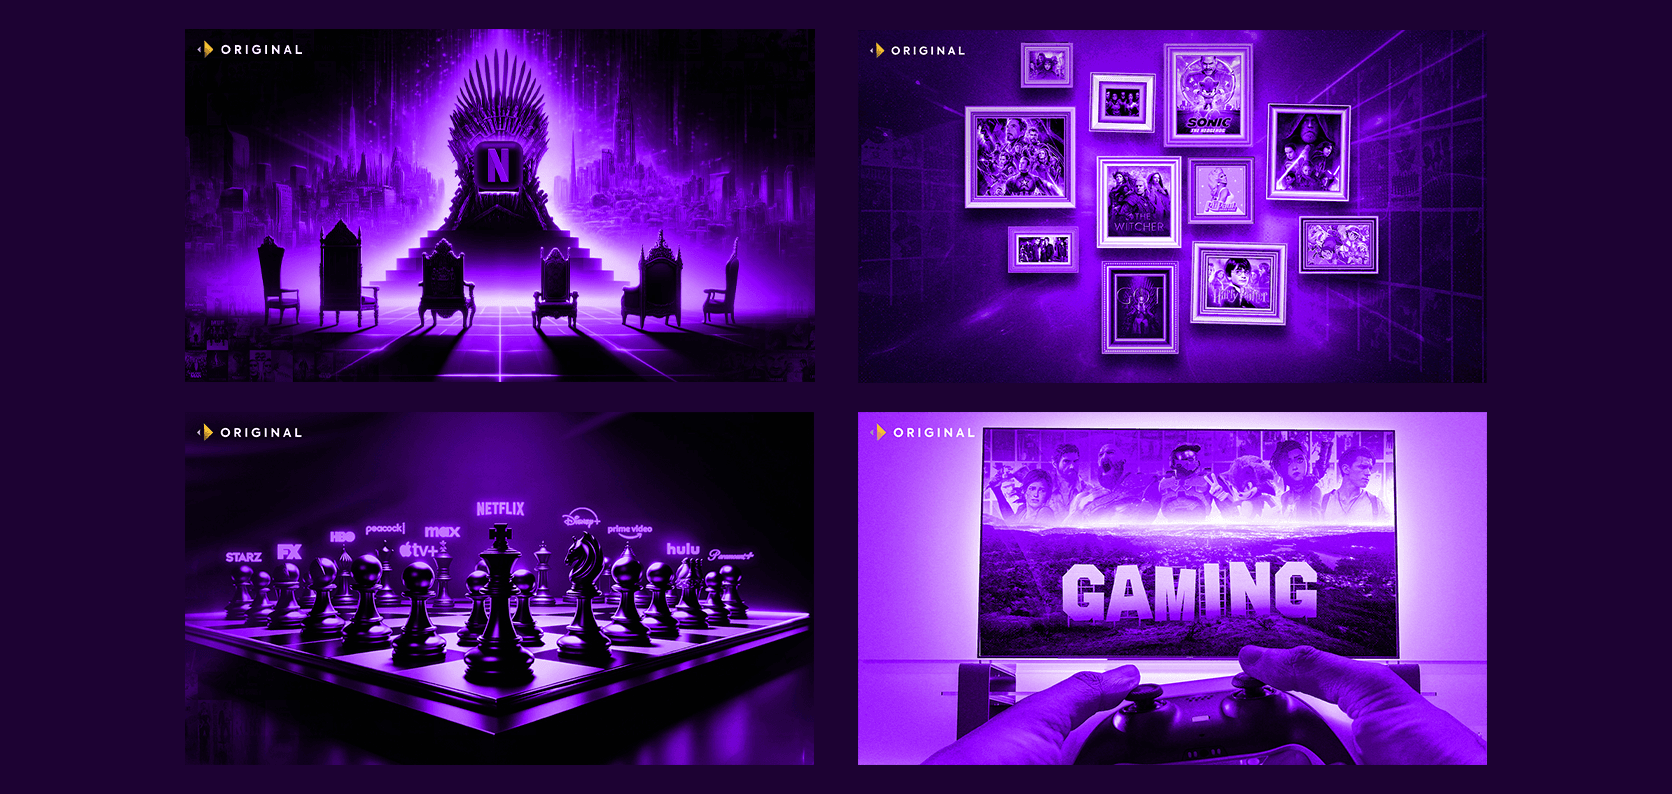
Poster Artwork Creation: Designed posters that effectively communicate the essence of Parrot Analytics’ services and data findings. The artwork aimed to capture attention while maintaining clarity and focus on the data presented.
Impact and Reflection
The data visualizations and poster artworks developed for Parrot Analytics significantly enhanced their ability to communicate complex data insights to a broad audience. The visuals contributed to:
Improved Data Interpretation: Stakeholders found it easier to understand and act upon key insights, leading to more informed decision-making.
Increased Engagement: The visually compelling designs captured the attention of diverse audiences, driving greater engagement with Parrot Analytics’ content.
Strengthened Brand Presence: By maintaining brand consistency and visual appeal, the project reinforced Parrot Analytics’ reputation as a leader in media analytics.
Key Features of the Project
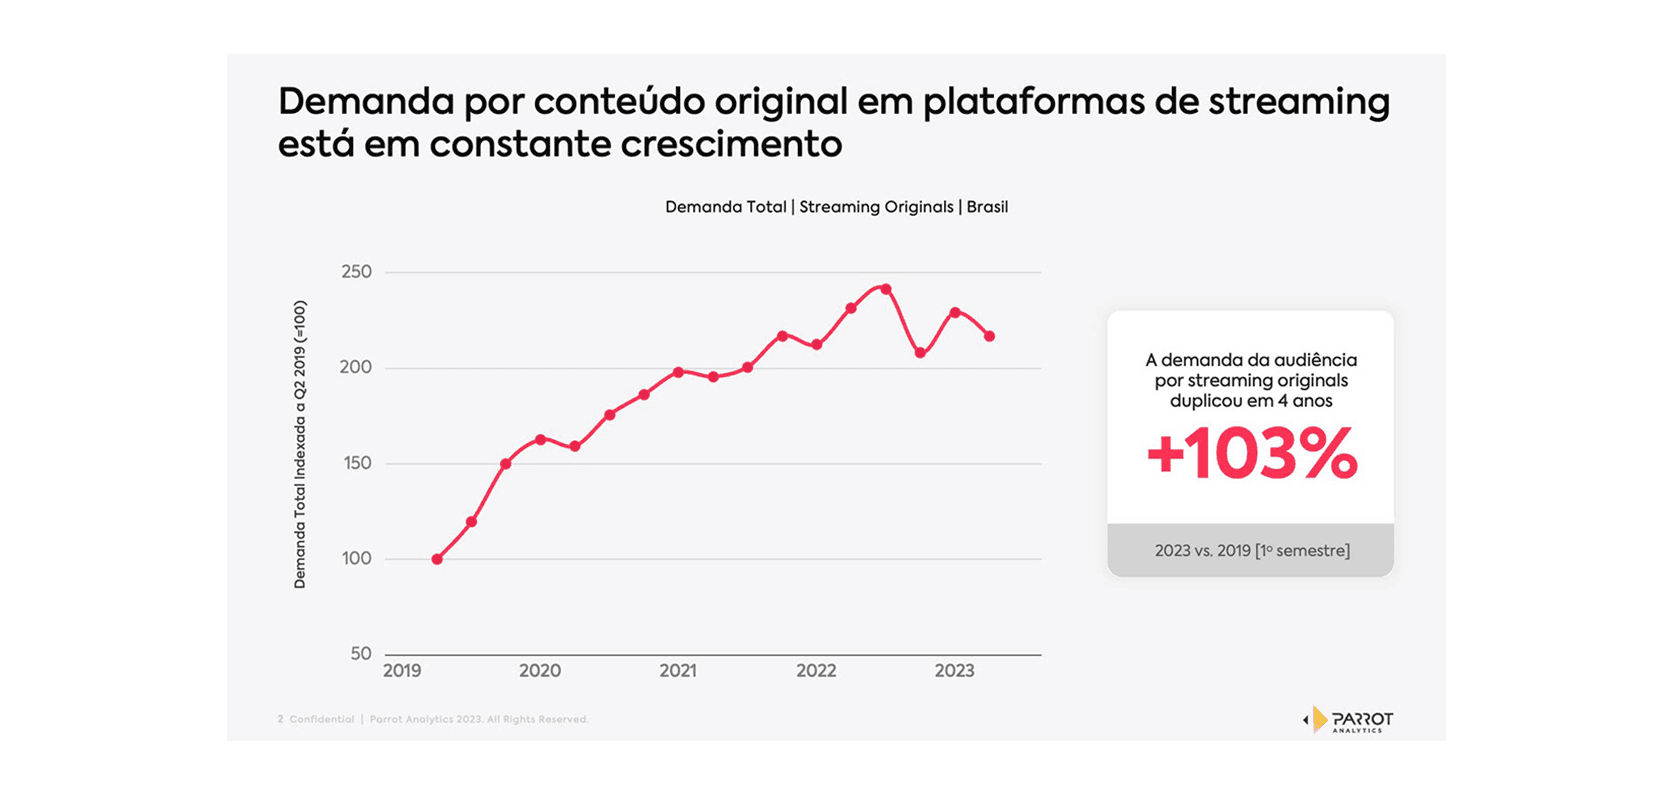
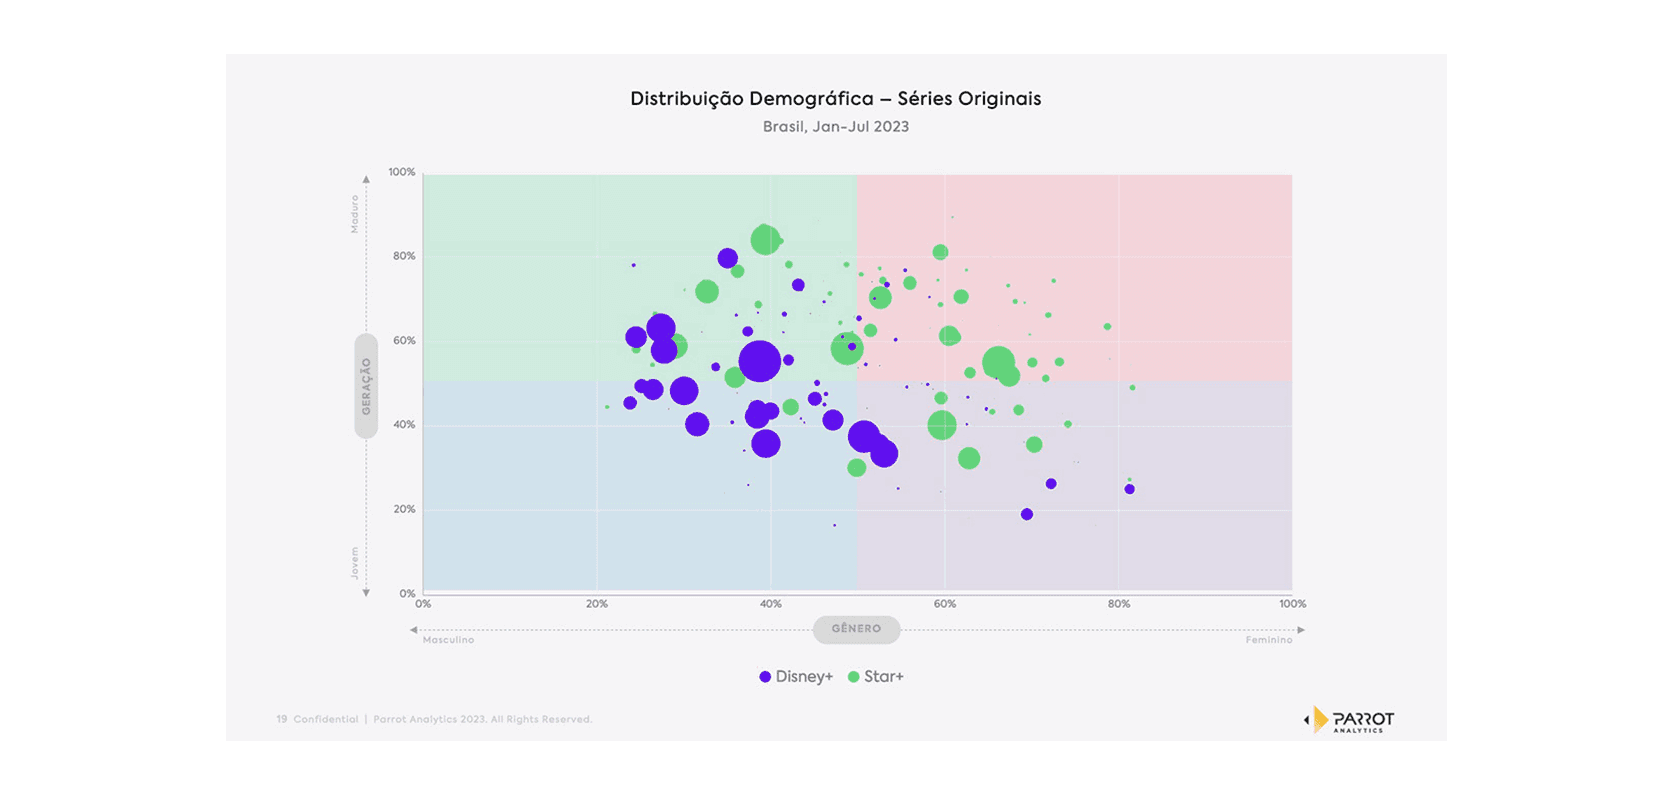
Data Visualizations: Developed to simplify complex data sets, these visualizations make media analytics insights accessible and actionable for diverse audiences. The visuals are designed to be both informative and engaging, facilitating quick comprehension and fostering data-driven decision-making.
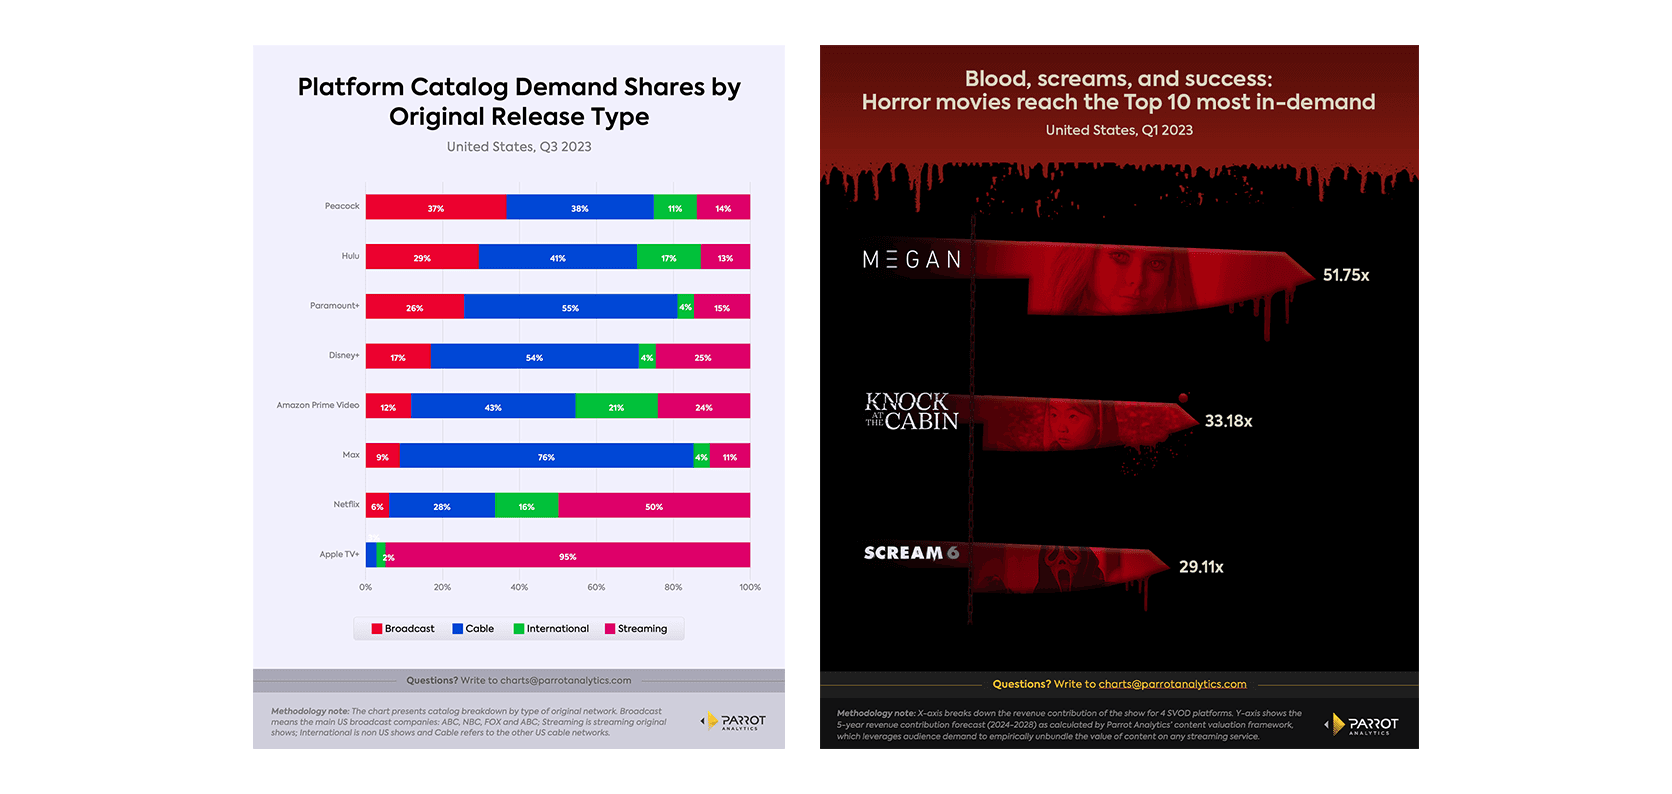
Poster Artworks: The posters created for this project were designed to stand out while maintaining a clear focus on the data. Each poster combines aesthetic appeal with informational clarity, ensuring that key messages are communicated effectively to all viewers.
Brand Consistency: Every visual element was aligned with Parrot Analytics’ brand guidelines, maintaining a cohesive look and feel across all deliverables. This consistency reinforces the brand’s authority in the media analytics space and ensures a professional presentation.
Conclusion
This project emphasized my ability to translate complex data into visually engaging formats, supporting Parrot Analytics in their mission to drive understanding and innovation in media analytics. By combining data visualization expertise with a strong sense of design, I helped Parrot Analytics communicate their insights more effectively, enhancing both stakeholder engagement and brand perception.